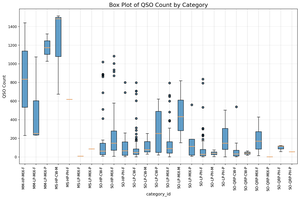
QSO Count by Category
Distribution of QSO counts across 25 different contest categories (operator type, power level, mode, station type)
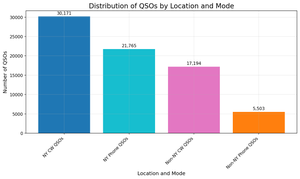
QSOs by Location & Mode
Breakdown of QSO activity between NY and non-NY stations, split by CW and Phone modes
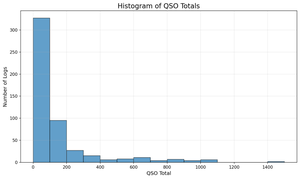
QSO Totals Distribution
Histogram showing how many stations achieved different QSO count levels during the contest
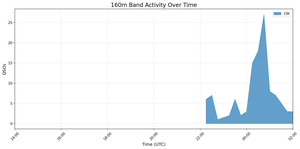
160m Band Activity
QSO activity over time on 160 meters, showing CW and Phone usage patterns during the 12-hour contest
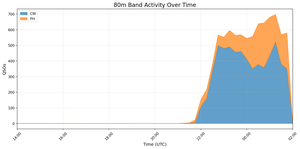
80m Band Activity
QSO activity over time on 80 meters, showing CW and Phone usage patterns during the 12-hour contest
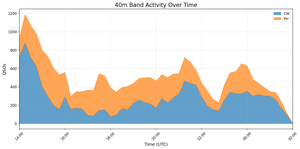
40m Band Activity
QSO activity over time on 40 meters, showing CW and Phone usage patterns during the 12-hour contest
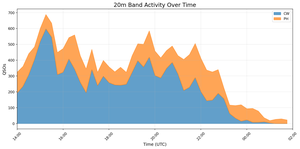
20m Band Activity
QSO activity over time on 20 meters, showing CW and Phone usage patterns during the 12-hour contest
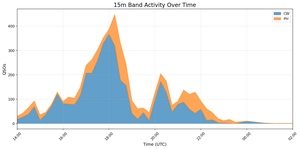
15m Band Activity
QSO activity over time on 15 meters, showing CW and Phone usage patterns during the 12-hour contest
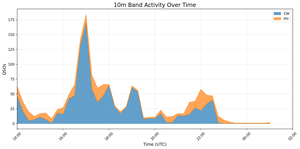
10m Band Activity
QSO activity over time on 10 meters, showing CW and Phone usage patterns during the 12-hour contest
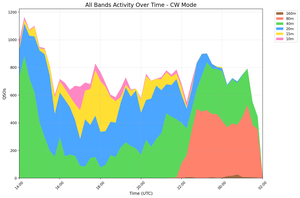
All Bands – CW Mode
Stacked view of CW activity across all HF bands (160m-10m) showing band usage patterns over time
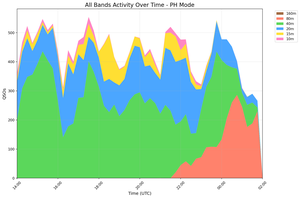
All Bands – Phone Mode
Stacked view of Phone activity across all HF bands (160m-10m) showing band usage patterns over time